AI in Trade Show OrganizationOctober 23, 20265 min read
Year-over-Year Comparison in Floor Space Sales: Why the Cutoff Date Matters
Comparing today's sales status with the final result of the previous edition almost always shows a gap. Only a comparison at the same distance before opening is meaningful, and that requires a recorded sales history.
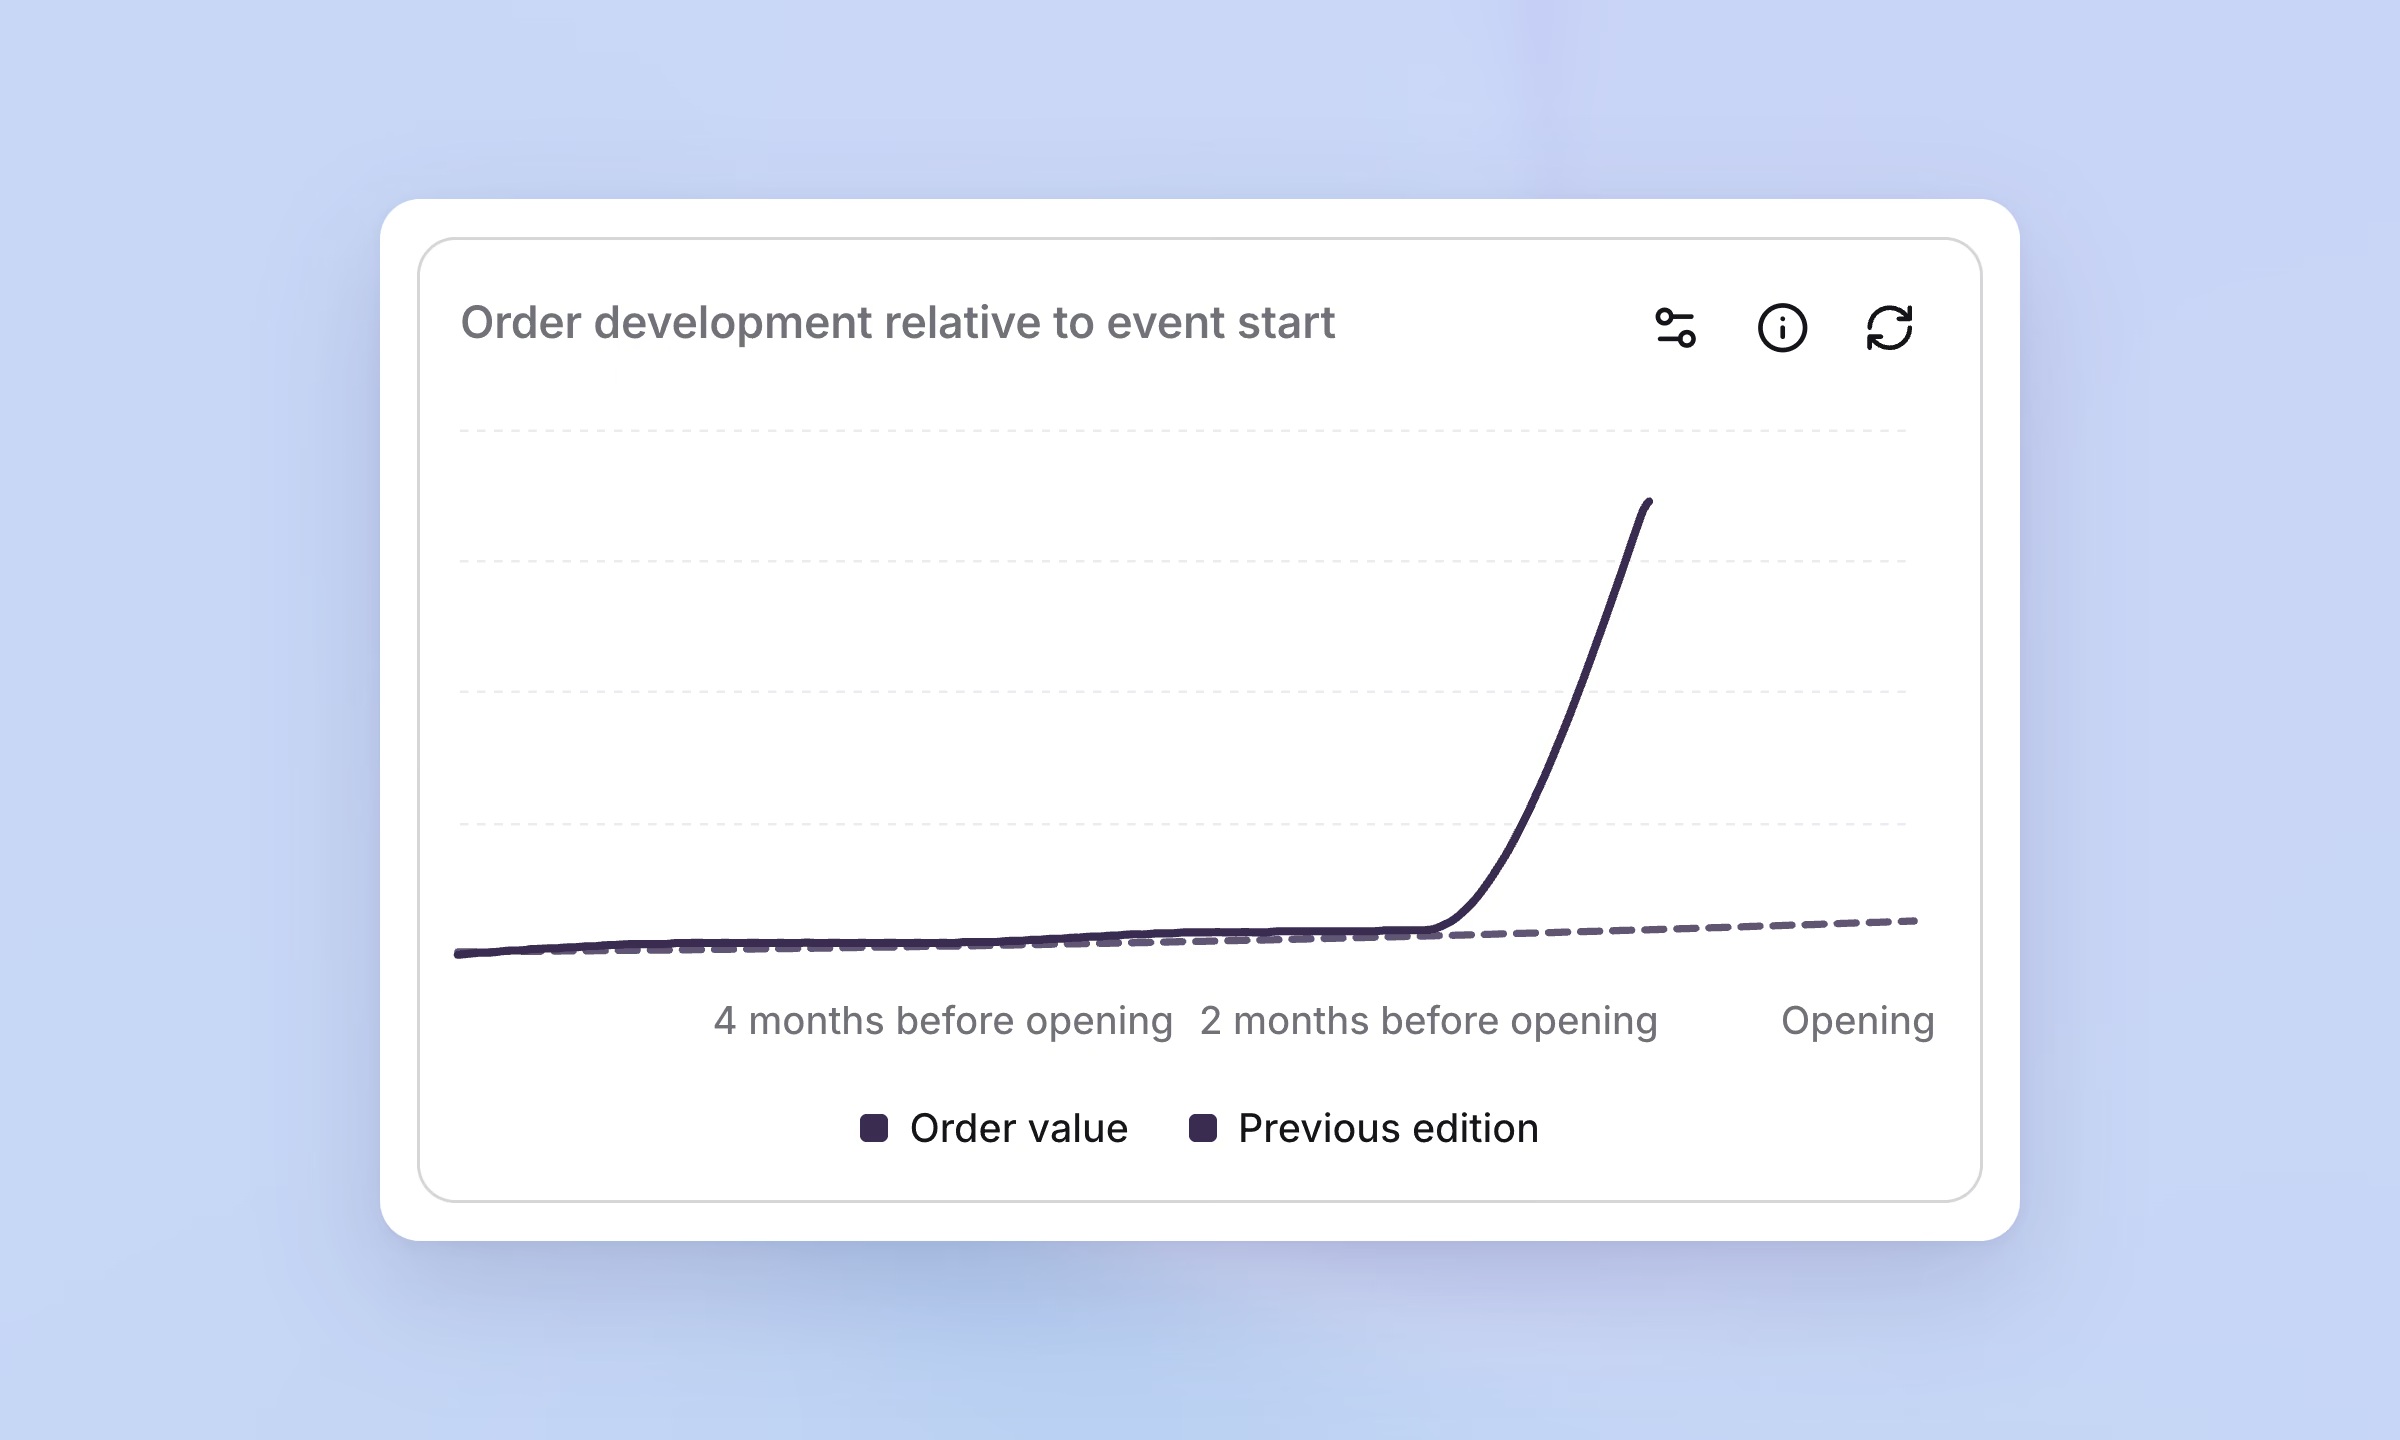
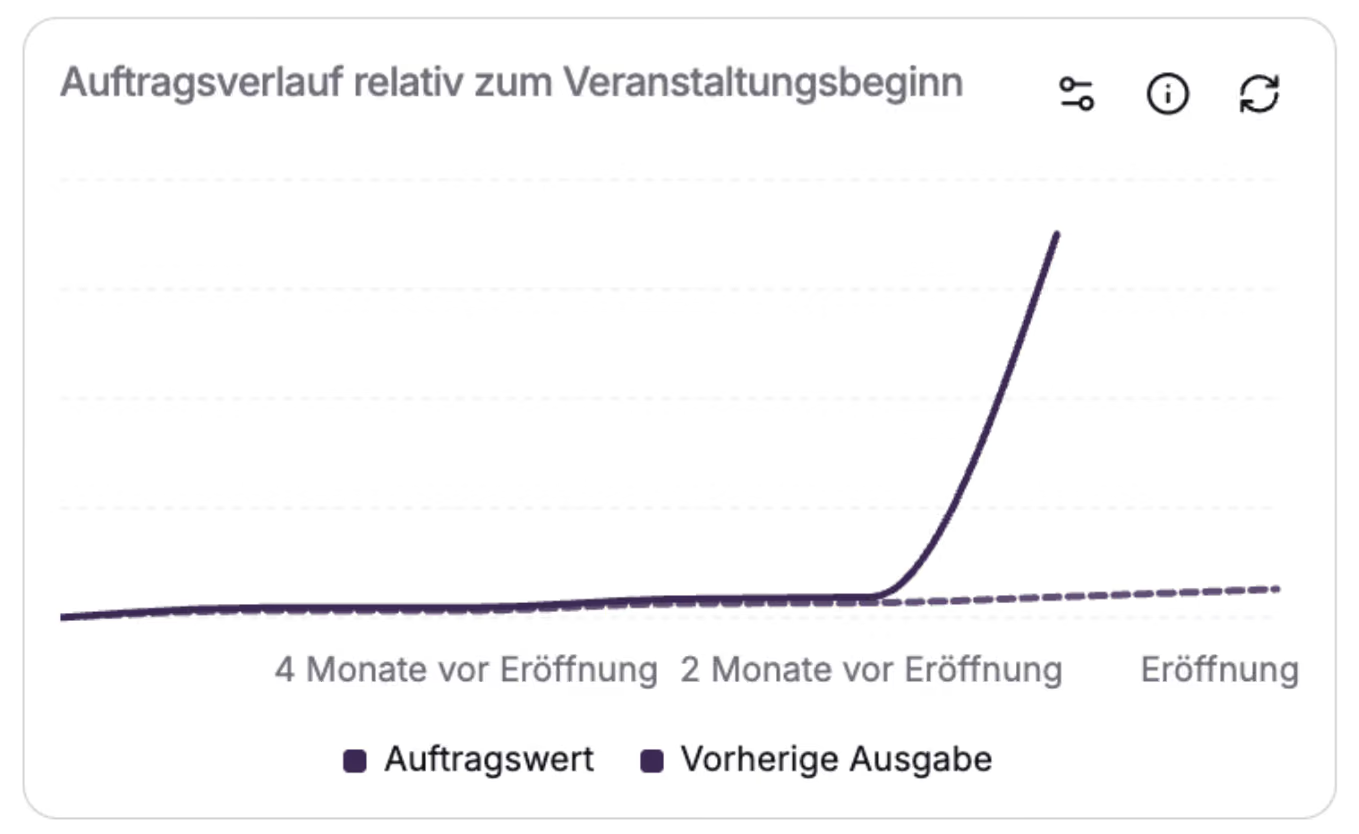
A year-over-year comparison in floor space sales is only meaningful if both values are measured at the same distance before opening. Trade show sales do not run evenly, and a large share of bookings comes in during the final weeks. Anyone comparing today's status with the final result of the previous edition will therefore almost always see a gap, even when sales are on track.
This article describes which three KPIs show the sales status per hall, how to read the result and the three ways the number comes about: a dashboard tile, a BI tool or a question to a BI agent. The overview of AI agents in trade show organization provides the wider context.
Why the final result is misleading
Trade show booking curves rise steeply toward the end: rebooking deadlines, early-bird prices and sales campaigns bundle deals into certain weeks, and the rest comes shortly before the deadline. 34 days before opening, a hall can be 13 percent behind last year's final result and still be exactly on track, if last year's sales were just as far along at the same point in time. Conversely, a lead at the same cutoff date shows weeks in advance that the hall will fill up.
Three KPIs per hall and cutoff date
| KPI | What it shows |
|---|---|
| Sold floor space in m² | What is contractually secured |
| Exhibitors with a booking | Whether a gap comes from a few large or many small booths |
| Floor space in open offers | What is still in the pipeline and may close in the coming weeks |
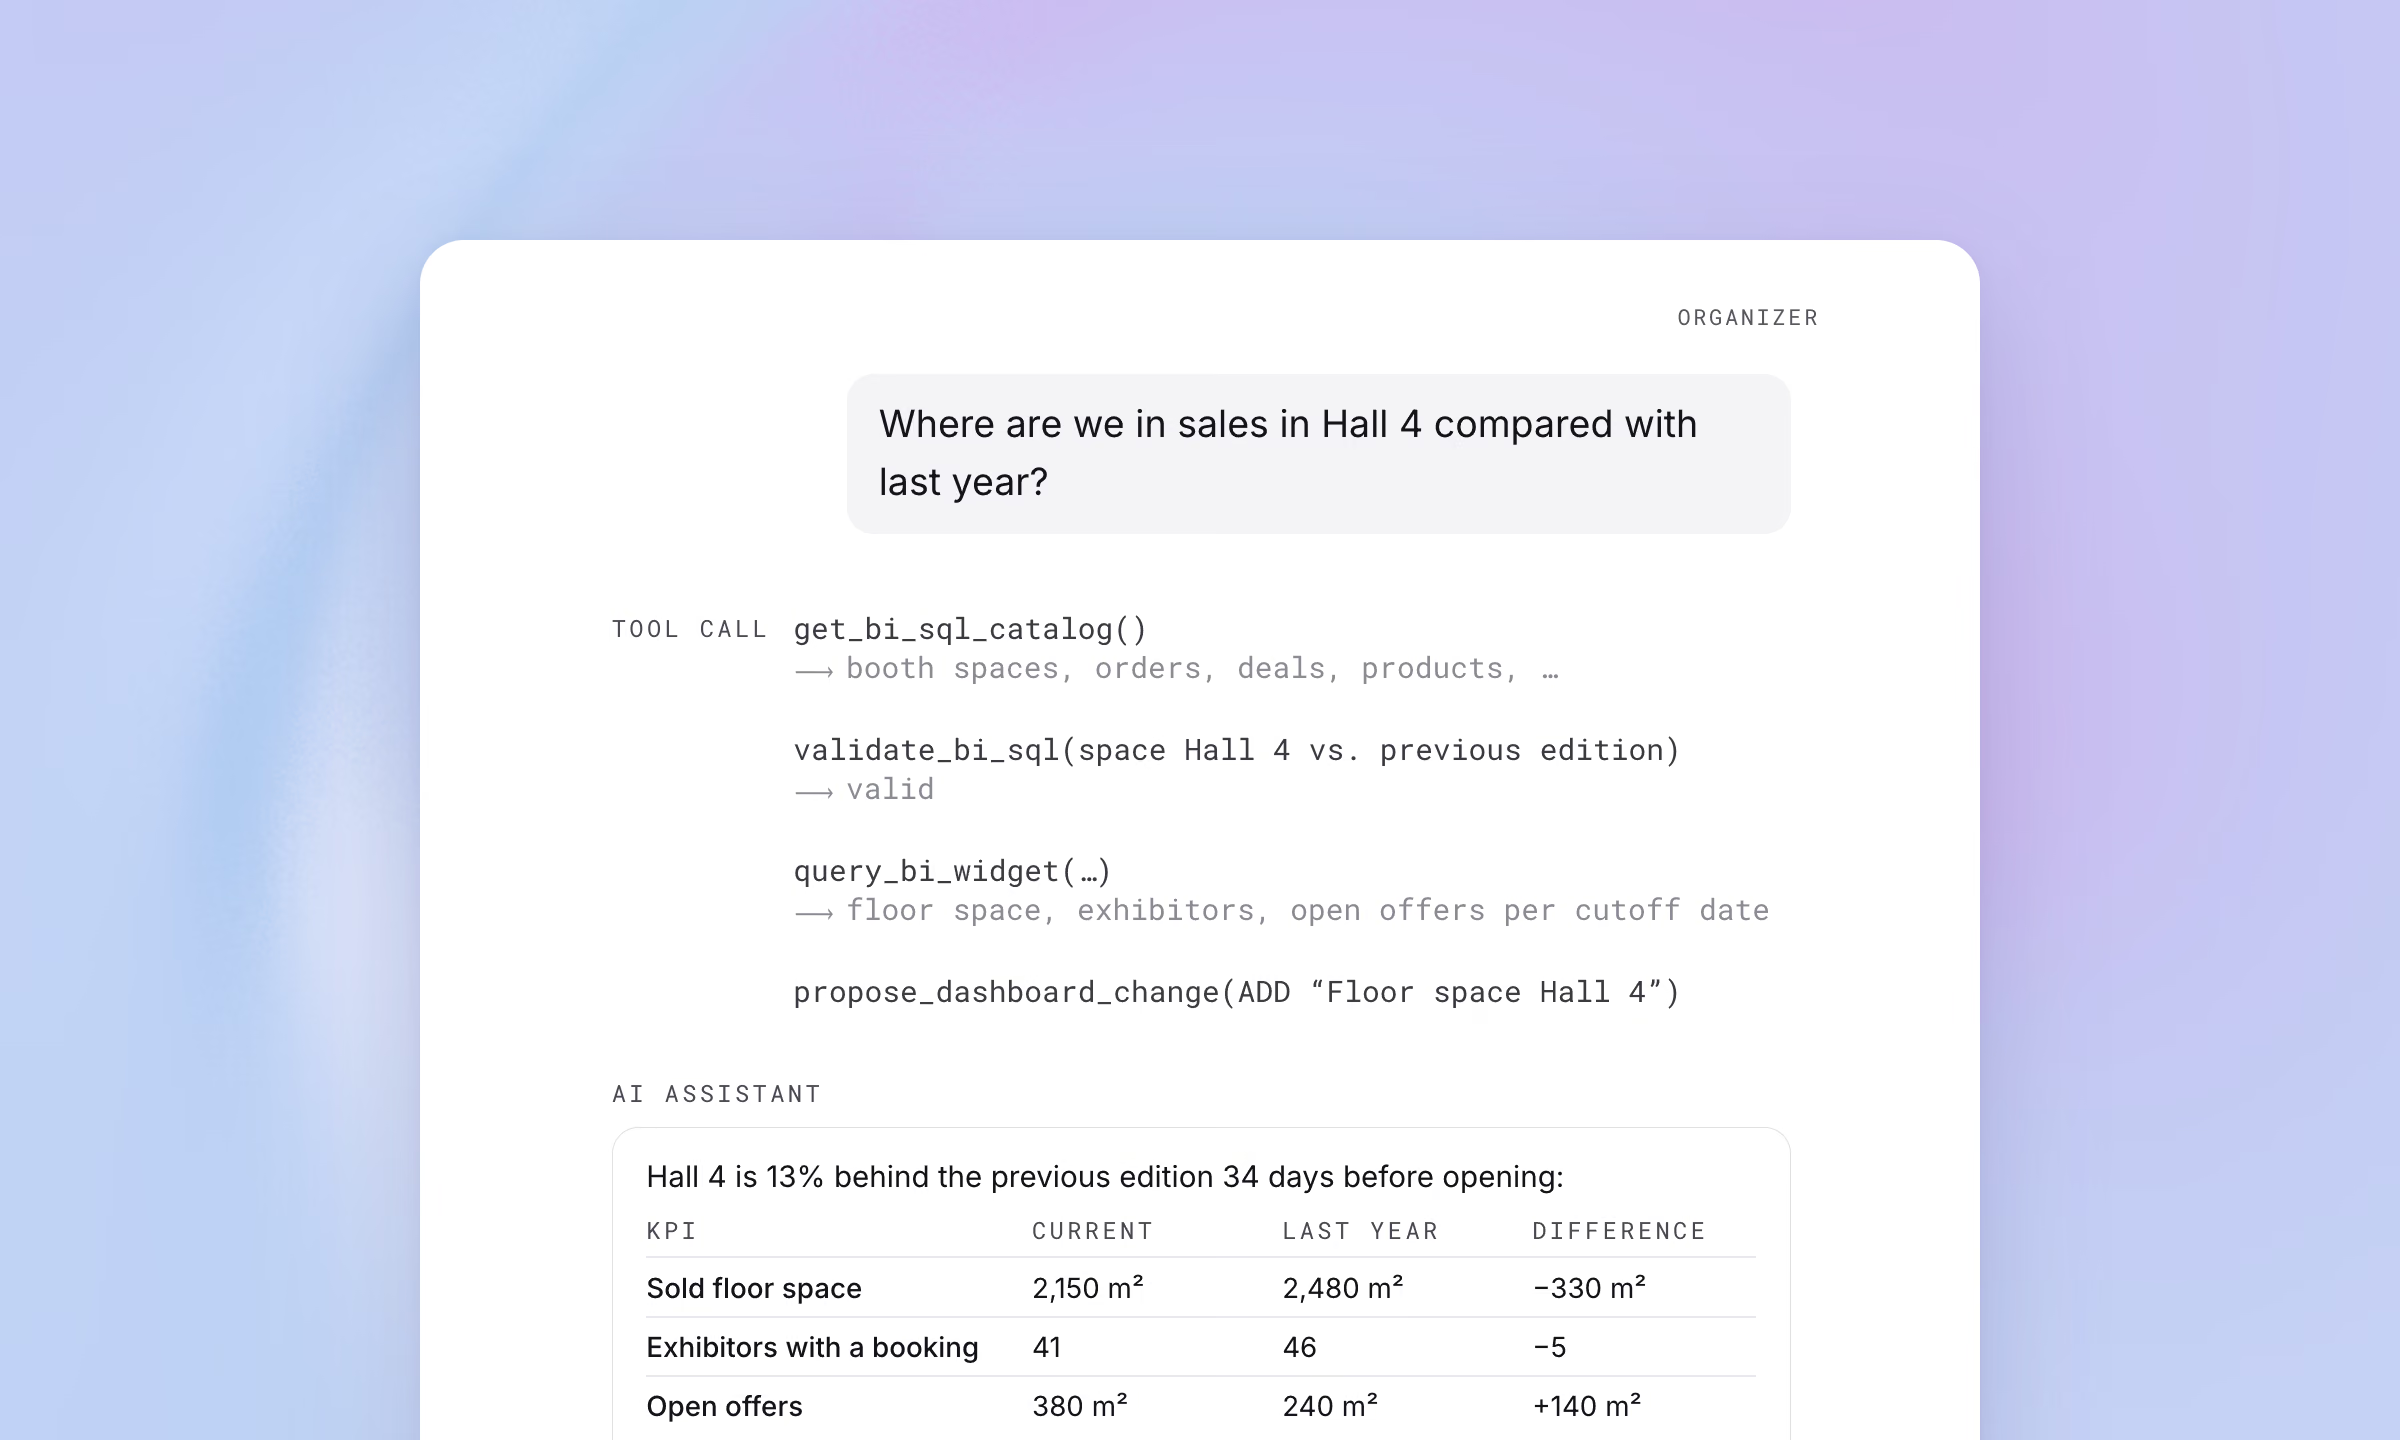
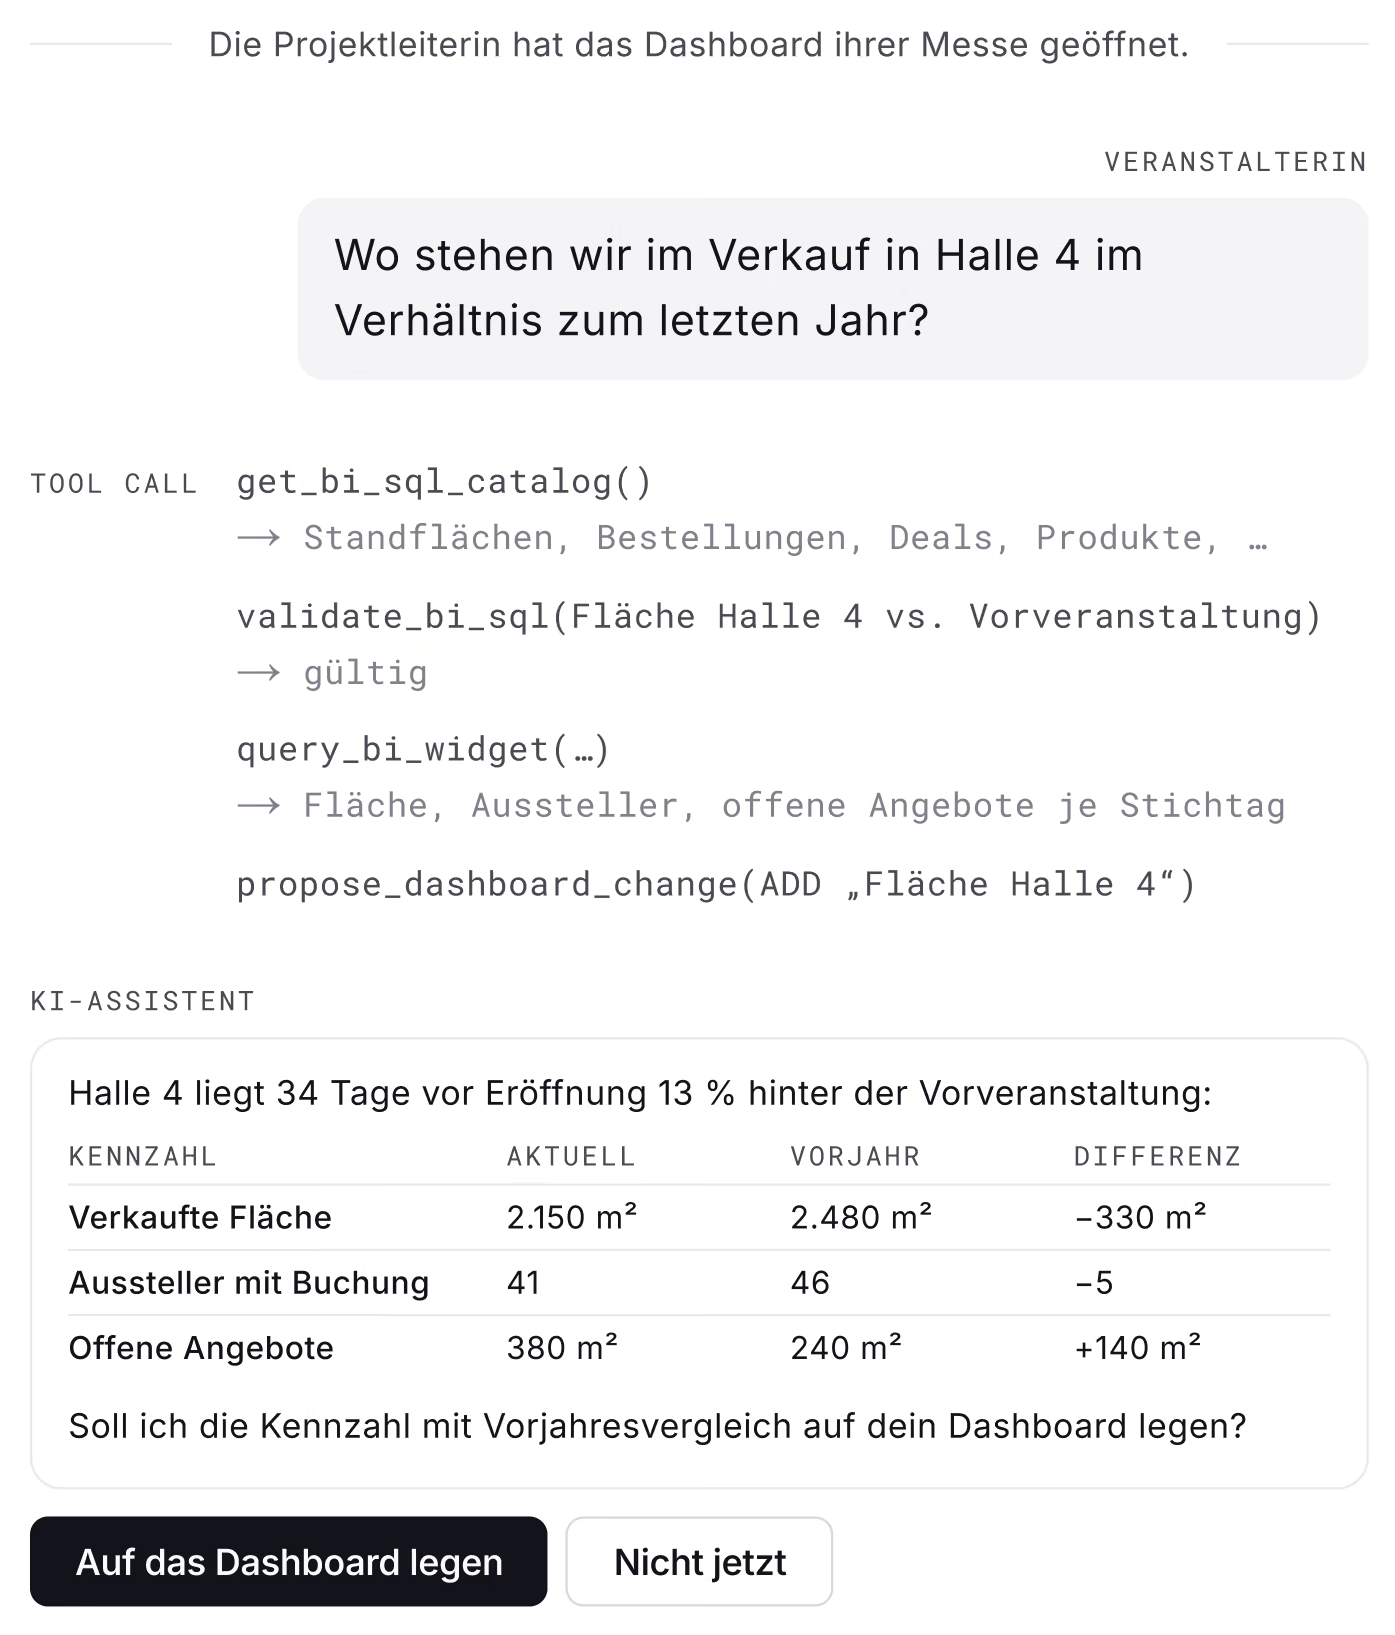
In the following example, Hall 4 is 13 percent behind the previous edition at the same cutoff date, 34 days before opening. All values are made up.
| Hall 4, 34 days before opening | Show 2026 versus previous edition, same cutoff date |
|---|---|
| Sold floor space | 2,150 m² versus 2,480 m², minus 330 m² (minus 13%) |
| Exhibitors with a booking | 41 versus 46, minus 5 |
| Open offers | 380 m² versus 240 m², plus 140 m² |
The table allows a first assessment. Sold floor space and open offers add up to 2,530 m², while last year the figure at the same cutoff date was 2,720 m². Including the offers, the gap shrinks from 330 to 190 m². Whether the open offers close, whether individual large exhibitors are missing and which measure follows is for the project management to judge. The numbers come from the system, people draw the conclusion.
Prerequisite: record the sales history
For a cutoff-date comparison, the system needs the sales history of the previous edition, meaning the status per day or week relative to opening, not just the final result. If this history is not available, the analysis should report “not available” instead of estimating a value. Anyone who records the history from the current event onward will have the comparison from the next edition. This ties in with rebooking: the earlier existing exhibitors rebook, the more meaningful the curve is in the first months, as the exhibitor rebooking guide shows.
Three ways to get the number
| Way | Suited for |
|---|---|
| Dashboard tile with a fixed definition | Recurring KPIs, identical for everyone on the team, no onboarding needed |
| BI tool with filters, dimensions and formulas | In-depth analyses by specialists who know the data model and the tool |
| Question to a BI agent | Ad hoc questions in day-to-day work that are too rare for a tile and too urgent for a specialist analysis |
The three ways are not mutually exclusive. Standard KPIs stay in the dashboard, the agent answers the questions in between and, on request, adds new KPIs there. Every additional option in the dashboard covers another case but also makes the interface more cluttered, and this trade-off cannot be solved with even more interface.
From a sentence to a report in five steps
As of October 2026: the analytics assistant in the Fairoo dashboard is built and runs in the test environment.
- Context from the interface. The open dashboard determines the event. The analytics tools are only available to the agent while the dashboard is open.
- Read the data catalog. The agent receives the schema of the approved data sources: booth spaces, orders, deals, products.
- Have the query checked. The drafted query “floor space Hall 4 versus previous edition” goes to the system. It checks validity and permissions and only allows read queries.
- Run the query. The result is floor space, exhibitors and open offers per cutoff date.
- Result and proposal. The agent shows the table and offers to add the KPI to the dashboard permanently. It is only saved after a click on “Add to dashboard”.
For standard questions such as “Which hall is currently furthest behind the previous edition?”, the agent uses vetted templates instead of freely drafted queries. What it can answer is determined by the data catalog: in the implementation described, it knows halls, product categories, the sales pipeline and deals, but not yet exhibitor groups. If data is missing, the answer is “not available”, and the agent does not estimate a substitute value.
Trade show organizers see considerably more potential in such analyses than exhibitors do. In the 2025 study by AUMA, the Association of the German Trade Fair Industry, organizers rate the field “business intelligence and data-driven decision support” with natural-language queries at 4.0 out of 5 points, exhibitors at 2.6. Among the fields that organizers rate higher than exhibitors, no other shows a gap this large.
Conclusion
The year-over-year comparison stands or falls with the cutoff date. Three KPIs per hall, measured at the same distance before opening, show what is secured and what may still come. The prerequisite is a recorded sales history; how the number gets onto the screen, whether via tile, BI tool or question, is then secondary. Fairoo brings booth spaces, offers, bookings and deals from the CRM and the floor plan together in one database. The limits that apply to a read-only agent are described in the article on securing AI agents.
Sources
- AUMA and Prognos: Messen im Zeitalter von KI: An der Schwelle zwischen Experiment und Integration (Trade fairs in the age of AI), October 2025, expert panel of 23, table 6, p. 59, in German. auma.de (PDF)
Demo
Book a no-obligation intro call
In a short intro call you'll receive trial access and can walk through a process live using one of your own events, with no commitment.
Frequently asked questions
How do you compare a trade show's sales status with last year?
At the same distance before opening, for example 34 days before, not against the final result of the previous edition. This requires last year's sales history per day or week. Without it, no reliable cutoff-date comparison is possible.
Which KPIs show the sales status of a trade show?
Sold floor space in square meters, the number of exhibitors with a booking and the floor space in open offers, each per hall and cutoff date. Together they show how much is already secured and how much is still in the pipeline.
What happens if last year's data is missing?
Without the sales history of the previous edition, the analysis should report “not available” instead of estimating. Data recorded from the current event onward enables the comparison in the following edition.